Monday, April 25, 2016

SWOT Analysis

SWOT is a strategic planning tool used to evaluate the strength, weakness, opportunities and threats to a project or a new idea thus evaluating the way to carve the result. Strength and weaknesses are considered the internal factors, while opportunities and threats are external that can have an effect on the organization or on the project. It is an important part of the project planning process in current business world.


Strengths include the attributes of the organization that would help achieve the project objective. These would also include the advantages of the result, profit it brings the organization, uniqueness of the project. Weaknesses would include the attributes of the organization that stop achievement of the project objective. Some of the factors which would come under this label are expertise unavailability, budget limitations and things to avoid in market feasibility. Opportunities are those external conditions that help achieve the project objective. It would cover to analyze the trends in market and its potential, technology and infrastructure development, market demand and R&D. Threats are the external conditions that could damage the project. Some of the factors in threats are environment, economy and its seasonal effects, obstacles with respect to field and feasibility to current market. Business model now a days also use TOWS which emphasizes the external environment, while SWOT focuses on the internal environment.

The SWOT analysis is typically conducted using a four square template where one would list down all the Strengths, weaknesses, Opportunities and Threats in each box. This is achieved through the brainstorming session among the group to capture the factors in each box respectively. Then a finalized version is created for review. This would help develop short-term and long-term strategies for the business/project. This would help us generate or maximize the positive influences on the business/project and minimize the negative influences. The SWOT analysis thus forms into a simple but useful framework for analyzing and kicking off the strategy formulation to make the project a successful one. One has to make sure when carrying out the SWOT analysis to be realistic and rigorous at right levels. Thus SWOT analysis forms into regular strategy meeting among the group to achieve what business requires at appropriate time.

Friday, April 22, 2016

Force Field Analysis

Force-field analysis is one of the primary principle used in business development, process management, decision making scenarios and social sciences and was found by one of the pioneer in the field of social sciences, Kurt Lewin. This has time and time proved many business models how powerful a simple methodology which overviews different forces acting on a potential change and for assessing their source and strength. The principle of force field analysis is that in any change/situation (driving forces) is at any given condition/point because of counterbalancing forces (restraining forces) are keeping it 
that way.


The driving forces are the forces acting on a situation that are supporting the state or condition and the restraining forces are those restraining the driving forces. The approach is to achieve the equilibrium in change situations – which is driving forces to be stronger than the restraining forces. Lewin’s model included 3 important steps. First one is unfreezing, which is reducing the strength of forces that has been maintaining the current equilibrium. Next one is moving, which develops new organizational values, attitudes, ideas that will help the situation move on. Final one is refreezing, which stabilizes the situation after the changes implemented.

The force field analysis process is implemented on a particular issue or change with the group of people analyzing the situation. The members of the group would identify and list down the driving and restraining forces affecting the issue or change which needs to be implemented. But the users need to define the target of change before outlining the forces affecting it. The target of change is written in the box and all the driving forces are written on it left side, while the resisting forces are written on the right side. The driving and resisting forces are then sorted out with the magnitude ranging from one (lowest) to five (highest). This would help the team to analyze the imbalance in the equilibrium. Then the team would researches around the forces and would determine the changes needed to strengthen then driving forces and weaken the restraining forces. This helps the team to record and review where there is consensus on an action or way forward. The team would finalize what actions/plan needs to be done/changed to achieve the situation/change intended. This Field-force analysis also helps to create alternate methods to support value based management eventually.

Tuesday, April 12, 2016

Portable Modular Data Center

Portable Modular Data Center (PMDC) is new approach to the modular and efficient data center solution and is the part of the IBM Data center family. This is done by taking the entire data center and building it inside the containers following ISO standard. It can be shipped easily across the countries or to other countries by truck, ship and in some unique cases through plane. Main reason to build it inside the container is it can be stored in controlled environment, thereby making its installation easier and also provide versatile movement for any purpose. This solves the problem to temporarily provide support to data center which might need expansion, recovery or replacement.


An example of PDMC is shown, which is 20 x 20 x 8 feet of dimension, but also has an expandable option to fit more IT equipment inside the container based on client’s requirements. The entire container is well insulated and fire protected, RF insulated and electromagnetic insulated, thus protecting the data from the devices and the equipment from damaging. The sensors inside the container also record data of people entering, the temperature, and humidity. They are built using the rack system on the rail for maintaining and accessing the devices, cables and equipment. It has open IT architecture which enables to install any IT equipment and it doesn’t need to be IBM equipment alone. There is a separate chiller equipment, UPS and separate heat exchangers which fits in nicely in the container which provide the adequate temperature for the devices. Traditionally it was possible by a separate device but IBM managed it by partnering with other leading suppliers to fit into this new integrated concept of PMDC.

The detection and suppression system helps taking the air samples constantly that checks for particles in air which might cause fire and if it senses it release the gas to avoid it. On the other side we see the main power panel which contains main circuit breakers and its branches, transient voltage suppressor to tap the incoming power supply for its performance to the UPS. All these helped in developing the turn-key data center within the container. Originally this solution was intended towards small market such as oil exploration, military operation but found people required this during temporary space during expansion or repair time smoothly. In order to operate this PMDC, three essentials are needed – electric power to operate, water source for the humidifier and the network connection to connect to the outer world. The typical design of this PMDC has PUE of 1.3 when compared to the traditional ones which has 2.5 to 2.7. The cost of 17 racks container would be around 500-600 thousand dollars.  

Friday, April 8, 2016

Data migration checklist

 Data centers being a complicate system with software and hardware combined does require proper migration checklist to avoid risks of data loss, business failure and disruptions. This article explains about the checklist/guidelines for data center migration checklist. To start with first step, which is the reason for migration. A deep analysis of reasons for migrating should be understood along with the potential challenges an IT business will face. This would help the company saving more money which can be achieved along with Data consolidation and right sizing by combining the systems. Second step would be the clear cut plan mapped out for migration. This would include finances to be considered along with the limiting factors such as system availability, security of the data and new systems for potential growth in future. Next step would be getting everyone on board. Because a mere organizational change would affect the growth and future stakes of the company. Team effort would reduce panic the team would need to handle to migrate to the new system. It is also important that other employees knows about the migration deadlines and also address their concerns are well supported.

Fourth step forms the important core which is to identify the support systems such as hardware, software, network, servers, cooling and power systems and the data involved in the migration. This would help the system migrating smoothly without losing data. Fifth step would be identifying the data interruption/downtime during migration. This would though involve more planning with different functionaries and the windows of backup to provide help. Sixth step would developing the contingency plan and keep up with what may arise during migration. This will lessen the impact of problems arising during migration and also reducing the downtime. This would also include how much business would spend on devices to support and also form the future system. Next step would be dealing with the small stuffs such as enough support from staffs/people during the migration, unexpected delay and availability of devices at the right time.

Eight step would be taking baby steps and not giant leaps. Since the data transfer would require to happen in different steps, testing has to happen at different steps such as installation, deployment and dry run testing. IT team would also test the backup systems before making the change. Ninth step would be handling of the old system/devices for which a detailed decommissioning and rebuilding plan which will reduce the E-waste and also have old data wiped out completely. The final step would be the Process Update. This has to be done by managers who would be documenting the procedures/processes to help the staff/employees getting accommodated with the new system. When this checklist is followed by the team, the business would benefit from dealing with any problems arising during the migration. 

Monday, April 4, 2016

What Does Open Source Software Mean to US Government?

The US Government has shown its love for Open Source Software. On March 10 the White House published a blog post that declared a new campaign designed to increase the use of open source by the government. It also drafted a policy document on source code, which is open for comment on GitHub. According to the government, the new drive toward open source reflects an effort to save money, avoid failures and help easier collaboration. “We can save taxpayer dollars by avoiding duplicative custom software purchases and promote innovation and collaboration across Federal agencies,” the blog post said.


For supporters, the government’s promise to become more friendly toward the idea of open source is no doubt a foot in the right direction. The only problem is, the way the government is defining Open Source and how they are setting it in their terms. The blog post simply mentioned  sharing source code between federal agencies, and releasing a fragment of the code to the public. Also the only open source projects that the blog post mentions are ones that center around open data more than open code. It revolves around information and databases of it, not codes. The use of open source coding to generate the web interface is not to be confused and related to what open source coding really stands for.

In that respect, the government seems to be confusing open data with open source code which is a very different thing from developing and sharing source code publicly. More engagement by the federal government with open source is not a bad thing, even if the government doesn’t get it totally right. Yet by failing both to define open source and to appreciate the significant difference between open source code and open datasets, the government is altering to its own satisfaction, the meaning of Open Source itself. Considering data and information available as open source without considering the source code that is used for everything to be built upon and is the actual underlying structure that runs these data warehouses and reserves, the value of open source starts dropping to a point where it becomes insignificant. 

How to Choose a Micro-segmentation Solution to Protect VMs

It is a fact that virtualization is looked upon to reduce the physical boundaries between applications and work and making it virtual and dynamic. There has been a hunt by the companies for a long duration now in search of a method or technology that can provide similar effects for security control in a cloud and control the traffic through its data centers. Thus came Micro-segmentation. It uses software technology to manage virtual machines, wherein the VM are present on different or the same servers, different grouping, isolation and more and can still be all controlled effectively and access control can be applied.


To ensure security, traditional networks are usually divided into security zones, where groups of assets such as servers or desktops are put on different network segments. Security policies are then performed over the traffic between these zones. The zones can be set up as needed for departmental boundaries, functions or for security. This division creates regions where access violation doesn't affect or penetrate the other zones as quickly and effectively and in turn doesn't hinder the daily  and regular usage of the cloud and it's usage performance.

Micro-segmentation is not a complete fix though. There are issues like Virtualization Security that are yet to be answered by it. Micro-segmentation is held accountable on multiple stands, some of them being the technology needing to offer the same level of elasticity that the data center provides, handling both the change in the size of the physical infrastructure, as well as the change of workloads that run on the infrastructure. Also the need to work with a diverse set of hardware and software environments stands strong. In order to provide on-demand security in the virtualized environment, it is necessary for the Micro-segmentation to support changes to security functionalities without changes in the infrastructure. To end this off, the Micro-segmentation solution needs to integrate well with cloud orchestration and avoid intrusive changes to the cloud infrastructure.

Google Data Center

This video describes about the Google data center located at Dalles, OR, where even most of the Google employees can’t get in due to security clearance. Site Reliability Engineering Team writes and maintains the software system to maintain perfect running of the services and avoid failures. It has 24/7 team of SREs on call to tackle any problems related to unexpected failures though highly redundant power, networking and serving domain and thus preventing the loss of cluster and minimizing the impact.


The entry into the data center floor is protected by biometric iris scanner and circle lock door and would require dual authentication to get in. The data center floor showing lot of servers forming a single cluster. Management of these servers would require several tools such as Borg, Colossus and Spanner along with Kubernetes, Google Cloud Storage and Big Query by Google engineers and Cloud customers. One of the network engineer explains working of Hardware Ops to expand the data center to deploy additional machines inside the building. And Google had preplanned for all expansions of this quantity using Jupiter, which is their data center technology providing hierarchical design using software defined networking principles. The Single building supporting 75000 machines require lot of optical cable fibers and carry over one petabit per second of bandwidth. This has helped Google to reliably access storage with low latency and high throughput. It is also noted that Google runs on B4, which is their private network and has been growing faster than our Internet-facing network. This connects all of the Google data centers and allows smooth access of resources across them. Next, the Google data center’s safety protocol of data storage is explained. On a daily basis the hard drives are shredded and wiped out to protect our data when there is hard drive and SSD failure. But the protocol calls for strict chain of custody from the time of hard drive being removed and commissioned for a new one.

Next comes the important part where cooling and powering the infrastructure is explained in the video, since lot of heat are generated inside the server area and has to be removed. The cooling plant on the site has two water loops, the condenser and process water loops (differentiated by different colors). The process water loop take the heat off the server floor and the condenser water loop takes the cold water from the basin to the heat exchangers. Power usage efficiency (PUE) in most of the Google data centers were 100% with very low Power overhead. It also uses a chiller which at times required to be used to keep the water in the cooling tower at the desired temperature. It is this water which is used in condenser water loop.  This cooling tower would normally use evaporation to cool the water at a faster rate. Finally the Google-owned power station is shown, which powers the Cloud. This is where high voltage power enter the site before going to distribution centers. And also uses multiple generators to prevent outage. Best part is all the power is coming from nearby hydroelectric power station and thus achieving 100%carbon neutral.  

Why Google Doesn’t Outsource Data Center Operations

To start off, Outsource means contract (work) out. Now we know human error is one of the root issues revolving around Data Center outages. That just means its avoidable, yet not preventable and is at the expense of the time of the user and the money of the company. Any mistakes just mean a ton of money going down as a loss. About 70 percent of data center reliability incidents are caused by human error on average based on a study by Uptime Institute, which shows only 15.4 percent of incidents at Google data centers were caused by human error over the past two years.
To bring this in terms of Google, we can't. Why? Because they go to the experts, the one percent. Now this one percent is not like the one percent you may find in places like Occupy Wall Street. These are, in Joe Kava, Google’s top data center operations exec, words, " highly qualified people, they are systems thinkers,” he said. “They understand how systems interact and how they work together”.  In fact, very few Googlers are even allowed to visit the company's data centers in the first place which in numerical terms can be less than one percent. The only time someone does get in there is when there is some specific business reason to be there, thus no one is there without a cause or plausible need, ever. Those responsible for the data center handling and operations work along with those who build and design the facilities. This allows consistent feedback and ideas being transferred between the teams, and thus each time a new data center is made, it's better than the previous one.  


The reason that Google doesn't outsource is pretty simple. The industry deals with the contractor who hands over the details based on design, the drawings and blueprints, manuals and so on to data center operators. Now the operator usually is not employed by the owner, but instead outsourced to the lowest bidder. This results in the owner having no actual control over the quality of service available nor the assurance that if something goes wrong, the operators will actually do something about it. 

Saturday, April 2, 2016

Facebook Data Center

This video discusses about Facebook data center. Handling the profiles of 1 in 7 people on earth needs staggering scale of devices and technology to handle the data. The data center of this 104 billion dollar company and the company which grows at the rate of 100 million users every six months is explained with immense information and its challenge. In order to handle such a huge data would require a monster data center which was first opened in Prineville, OR which is having a size of three football stadiums together (memory chip the size of 300,000 sq ft and costed 100s of million dollars. It handles the data flying from your computer to internet at the speed of light and vice versa with 21 million feet of fiber optic cable.


Kenpachi, GM of the data center explains the working nature of the data center in this video clearly. The data center makes sure the data transfer from internet to data center to your laptop in milliseconds. The video shows the fine illustration of never ending servers in different racks. It uses 30 megawatts of electricity on tap inorder to prevent running out of power. They also use huge diesel power generators as backup to prevent power outage thereby preventing data loss. And these huge generators kick in immediately when there is power loss at all. The massive 7 room rooftop state of the art (chiller less data center) natural air conditioning system is used to cool the heat generated from the servers and acts as a heat sink. The cool air from high plains of Oregon is sucked in and mixed with warm air to regulate the temperature of the server area thus controlling the overheating of the servers. On hot days, the Prineville data center is designed to use evaporative cooling instead of a chiller system.


To keep up with increase in users and data available, thousands of servers and memories are brought in daily. They use both Intel and AMD chips with custom made motherboards and chassis, allowing the use of larger heat sinks and fans to improve cooling efficiency. In the event of a server failing the technicians get a notice of which one failed but is very difficult to find it in this massive place. The facebook has spent more than $1 billion for the infrastructure and are still running out of space to accommodate its growth. But with this rate of growth in online involvement, they need to better speed up increasing the size.  

Reference: https://www.youtube.com/watch?v=Y8Rgje94iI0

Friday, April 1, 2016

Data Center - Security and Risk Management

Security and Risk management in data center is discussed in this video. The first key challenge is risk management which is explained as layered physical security approach. This is to protect the data from criminals or third party contractors or from the employees who happened to access the data with or without their knowledge. This layered security approach is intended to detect, deter or detain the data from breach. This helps in risk free data management and giving peace of mind to us.


First layer is called perimeter defense which includes video surveillance and fence to protect the area, which would have limited access points and physical barriers. With this security layer, it delays access to the second layer and accessing the point of entry by intruders. Second layer is the clear zone which is the area between the security and the building area. This area is marked by video surveillance to mark intrusions to identify breaches. The third layer is the highest level perimeter security the data center would have and would have the opportunity to prevent unauthorized access towards the fourth layer. This would include key system, video surveillance, card reader, security vestibule, perimeter camera. Fourth layer of security validates the access to the individuals with Digital signage, card reader, mass notification display, IBW antenna and photo badging stations for the power/cooling facilities, data room to all the visitors and contractors. These four layers together combine the physical security of the data center.


Fifth layer of security is the selective profile security for the staff, contractors and visitors to ensure the access is limited and approved to this critical space using motion egress, button egress and data cabinet lock trigger panel. The sixth layer of security is to provide controlled access and accountability directly to the equipment location. The key list of materials list for physical security holds the key and can be challenging based on need. These six layers together mitigates your risk of ineffective protection of the data center’s critical data. The interoperability of components subsystems hold importance to various stakeholders of the critical data.

Thursday, March 31, 2016

Microsoft Data Center

This video explains the Microsoft data centers which has been supporting various systems/services such as Bing, Outlook, Xbox Live, Office365 and Microsoft Dynamics and more than 2 billion people around the world. This is supported by the extensive global fiber optic network which connects our PCs and mobile phones at the speed of light delivery and execution of queries. To add up these data centers support $20 billion in over 70 countries. From 1989 to 2004 the data centers were designed to control operating temperature environments. In 2007 the first generation data center was designed/opened at Quincy, WA. This facility has the size of 10 football fields and has high-performance servers with high-density racks separated by hot and cool air aisles along with traditional floor chillers, air handling equipment to give UPS system the support it needs. It ensures the operation to be interrupted in the event of natural disaster or during short term power interruption. A high-speed robust fiber-optic network connects this data center with other major hubs and Internet users. Edge compute nodes host workloads closer to the end users to reduce latency provide zero redundancy and increase overall service resiliency which supports engineers work around the clock to help ensure services are persistently available to customers.


In 2009, modular data center concept was used to build the Chicago data center. Being the size of 10 football fields, it reduced the infrastructure cost and the deployment time and uses 2400 servers and thus increasing sustainability and resilience. This enabled Microsoft to meet the customer demands for services within hours. This facility significantly reduced packaging waste and carbon emissions. This facility also uses waterside economization which enabled cooling effectiveness (PUE) without much power consumption (Chicago data center has a PUE 1.15-1.22). In 2009, Dublin generation 3 facility which has the size of 7 football stadiums was developed. This uses air side economization for cooling the units. The air handling devices draws cold outside air to absorb heat which maintains constant room temperature. This facility uses less than one percent of annual water consumption a traditional data would use and improve the efficiency by 50%.

In 2010, fourth generation for data center design building which uses airside concept from Dublin into a truly modular design. It uses pre-manufactured state of the art plug and play modular components and made using recyclable materials such as steel and aluminum. This reduced the entire construction time and also maintains the inside temperature between 50 and 90 deg F and 22% RH with the efficient PUEs and using 100% renewable hydropower for its operation. Microsoft uses its own data center repository calls to record power consumption and allow precise cost allocation to our internal business groups. In addition to it, the data centers has been protected by extensive camera, inner outer parameters thus increasing the security at each level. The Microsoft data centers has FISMA certification and several third party to verify their capabilities powering the cloud networking. 

Tuesday, March 29, 2016

Dell modular data center tour

Ty Schmitt, Executive Director for Modular Infrastructure, Mark Bailey, Principal Architect for Modular Infrastructure from Boulder Colorado explaining 2.5 megawatt capable site and contains various modules, to perform various functions, such as power module, IT module, cooling module, mixing modules, control modules and air handler modules. The intent is to right size the modules to make it perform its required actions at optimized costs. 


Based on the situation outside (how hot or cold it is), it decides what mode of operations would be decided. Ty gives an example of operation happening today with the weather condition today where the cooler air is mixed in the IT module where it becomes warmer and then mixed with the cooler air to get the ambient temperature. A second condition which is the “outside air mover condition”, when the ambient temperature is already achieved or the IT module is cool enough, the outside air just passes through the IT module to the evaporating module. The third condition is when it gets too hot because of what customer selected, it deploys a new track fabricated to use the swamp type of cooling to remove any kind of hot air in the system, thereby reducing the inner temperature by using the outside air.

IT module's critical elements are discussed to show the racks which are 54U and standard 19 inch racks specifically integrated to ship along with the racks. The rack designs were engineered architecture by the same team who engineered the modules. The full vertical solution to remove any fans from the server/system from IT all the way to the module itself. This makes the Dell modules more power dense. The custom racks where 400 volts in just a 3 phase pin is shown to depict the custom requirements Dell has satisfied for the customer. It uses 65U type racks mounted on standard type of mounting features. The concept of the power module is discussed where the right size of element, geography, and level of coolability is used to determine its size and budget spent on it. This takes the facility power in and distributes to IT and various air handlers modules.

Thursday, February 11, 2016

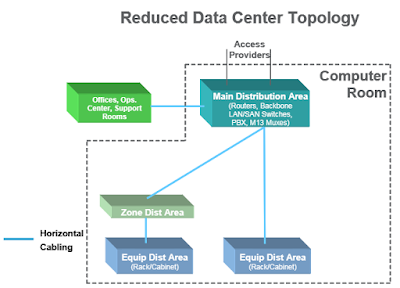
Zone Distribution in Data Centers

Data cabling infrastructures must provide;

  • Reliability - Should provide 24 X 7 uptime
  • Scalability - Should support data center growth. Must accommodate the need for more bandwidth in support for future applications.   
  • Manageability- Cabling infrastructure must also accommodate changing requirements. 
  • Flexibility - Make adjustments with minimum downtime.


Zone Distribution recommended by TIA-942
ZDA - Zone Distribution Area - consolidation point for high -fiber-count cabling from the Main Distribution Area (MDA) or Horizontal Distribution Area (HDA) to regional areas or zones within the data center. 


Thursday, February 4, 2016

Data Centre Design – basic considerations


Airflow and Cooling
Arranging servers and cooling units so that cooling is efficient and effective is important. The common method of cooling is utilizing rack-mounted fans. A “hot/cold aisle” design is the most efficient method. Server racks will be arranged in long rows with space between them. On one side of the server, cool air will be sent along the “cold-isle”. Server mounted fans will draw this into the rack while on the opposite side of the row, server fans will expel the hot air into the “hot-aisle”. The hot air is then sent out of the room.


Humidification
Humidification is usually the most wasteful component of data center designs. Today's servers can tolerate a range of humidity between 20%-80%. A safe humidity control range is 30%-70%. The most sensitive equipment tends to be the magnetic tape rather than the servers themselves. An efficient humidification plan would involve a central unit and would allow for seasonal changes. 


Power Supply
Data centers consume a lot of electrical power. This power is delivered from the grid as 400 volts AC but the circuits within the IT equipment run on DC 6 -12 volts. This means the voltage has to be first reduced by a transformer and then Converted from AC to DC by a rectifier. This is usually done by a power supply unit (PSU) within each piece of IT equipment, but is highly inefficient and adds to the waste heat. Furthermore the power will probably already have been converted from AC to DC and back again within a UPS (see below) so the losses are doubled. 


Cabling Pathways
Server organization and cabling is very important for a data center. Cabling should be organized in such a way that individual racks can be disconnected easily from the system. Separation of power and data cables is essential to prevent interference. Cabling, is expected be replaced every 15-20 years.

Environmental Control in Data Center

In order for data center to perform optimally throughout the lifespan, it is necessary to maintain temperature, humidity and other physical qualities of air within a specific range.

Air Flow
Why do we need efficient air flow?
  • Improve computer cooling efficiency
  • Preventing recirculation of hot air exhausted from IT equipment
  • Reducing bypass airflow
  

Overheating often results in reduced server performance or equipment damage. Atmospheric stratification requires setting cooling equipment temperatures lower than recommended.
The various control measures can be classified into:

Temperature
Recommended: 70-750 F / 21-240 C
In environments with a high relative humidity, overcooling equipment can expose equipment to the high amount of moisture that in turn allows the growth of salt deposits on conductive filaments in the circuitry.

Rack Hygiene
To ensure that the air from the cold aisle reaches equipment intakes and prevents leakage of exhaust air into the intake area, data centers implement blanking plates and other fittings around the edge, top, floor or the rack direct air intake. Effective airflow management prevents hot spots, with is common in the top spaces of the rack and allows the temperature of cold aisles to be raised.

Aisle Containment
Containments are used to prevent cool/exhaust air mixing within server rooms. In general, cabinets face each other so that cool air reaches the equipment at the set temperature. Containments are implemented by physical separation of hot and cold aisles, using blanking panels, PVC curtains or hard panel boards. The strategies of containments depend on
  • Server Tolerance
  • Ambient Temperature Requirements
  • Leakage from data centers
  • Access Floors

A raised access floor allows under-floor cable management as well as air flow. Access floors design can be classified into:
  • Low profile floors (under 6 inches in height)
  • Standard/ traditional access floors (over 6 inches)
Data center equipment is very sensitive and susceptible to damage from excessive heat, moisture and unauthorized access. IT WatchDogs provide a full line of environmental sensors that deliver exceptional protection and alerting functions without requiring any proprietary software installations of update subscriptions.

In short, data center environmental control is a practice that aims at creating a conducive environment inside a data center in order for keeping its content safe and secured.

Equinix Data Center Tour

Equinix is an internet business exchange and colocation company. The data center on the west of Chicago is 280,000 sqft and Equinix occupies almost 2 million sqft in the US alone. In further touring, we shall talk about the data center in Chicago.


It is 3 floors, the first has the facility and infrastructure and the other 2 floors have the colocation. Security at the center is taken highly into consideration having dozens of security cameras all around. Man traps and lock doors are looked into using biometric fingerprinting technology for access into floors and rooms. The video https://www.youtube.com/watch?v=WBIl0curTxU shows how an empty room was converted into server rooms. This was not built like a typical data center. The video showed the flooring of the entire center as concrete slabs. Being an internet exchange company, Equinix has to deliver large amounts of data through networks to customer with high speed.  For this purpose, the center had overhead cables built of copper fiber coax. The entire center was designed to be modular catering to the customer’s exact needs.
The main component of any data center would be the airflow management. Equinix uses CVAC systems for airflow on the top. Cold air was driven in the cold aisles from the top. Whereas warm air was driven in the hot aisles from bottom to top. The entire east and west sides of the building, including the colocation centers were air handler rooms. In the air handler rooms, we see the warm air that is coming up is taken into the filters kept in the rooms. The filter refreshes, recools the warm air and sends them back to the aisles accordingly. The building is on an average maintained at 68-720 F. For this maintenance purpose, sensors are located in all places. If the temperature goes above, the sensors call for more cooling. The building management system in turn will vary the frequency drives. The frequency drives are available on all floors.

From the hardware side, they have eight 750 ton chillers in the air handler rooms and 8 water cooling towers on the ceiling. If the temperature outside (external temperature) falls below 450 F, the mechanical cooling is shifted to technologies using the external temperature. This makes it less expensive and this reason why Chicago can be a great location for data centers.
Coming to power, the data center on average runs on 30MW. They have installed diesel generators and each generator’s capacity is 2.5MW. At all times, 12 will be online, 3 are on reserve if any of the 12 go down. In additional, they have 2 swing generators for maintenance purpose. Generators feed the switch gears too. Hence the switch gears have 2 inputs, one from the utility and one of the generators.  


Apart from all this, the Equinix data center is very customer friendly.